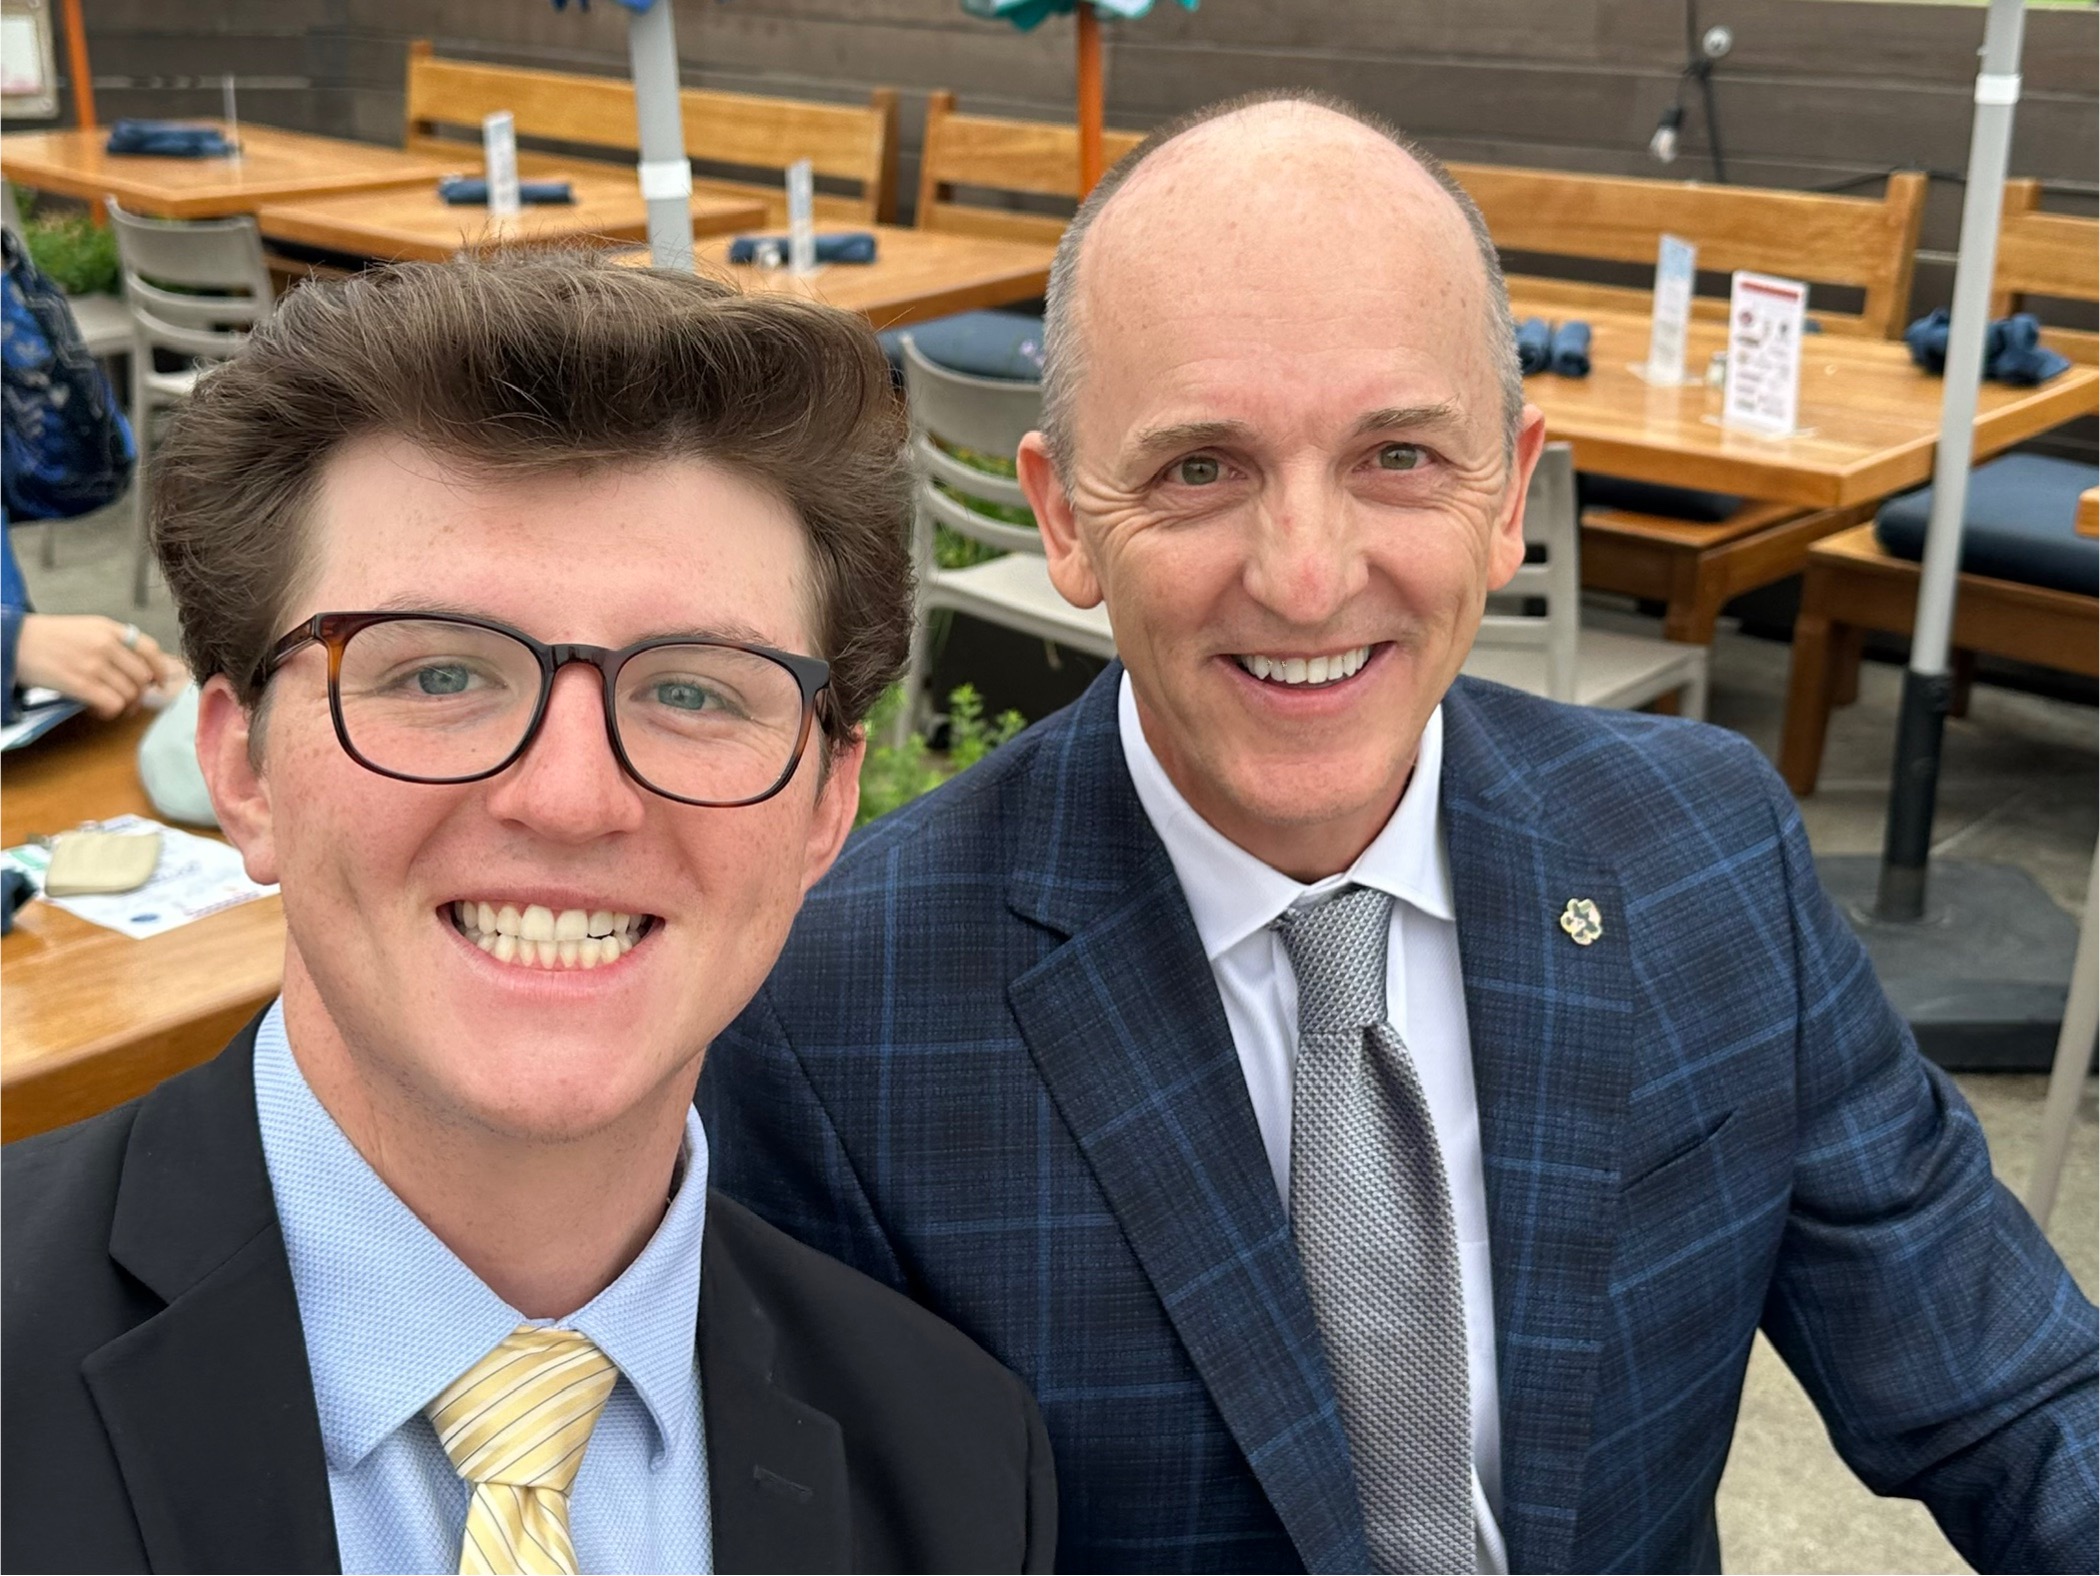
Going Long in Two Fields: Why TLT Could Be Your MVP During Recessions

Dear Mr. Market:

First off, if you want to know how amazing Artificial Intelligence is, the following list of article titles were generated for this article in the matter of four seconds! (we picked the first one and the rest of this article is typed with regular human toiling!)

FYI: If you’ve never used ChatGPT, before try it! Much of its delivery is on what and how you ask things and in this case here is the prompt/reply that we asked of it:

Certainly! Here are a couple of article title ideas that play on the “going long” football reference while discussing extending bond allocations, especially in a recessionary context and using the TLT ticker symbol:

  1. “Going Long in Two Fields: Why TLT Could Be Your MVP During Recessions”
  2. “Huddling Up for Stability: TLT’s Game Plan for Going Long in a Recession”
  3. “Scoring Big in Bonds: Going Long with TLT Amidst Recession Signals”
  4. “Touchdown for Investors: TLT’s Playbook for Going Long in Uncertain Markets”
  5. “Bonds and Touchdowns: TLT’s Strategy for Going Long in Recessions”
  6. “From Gridiron to Portfolio: Going Long with TLT’s Defensive Play”
  7. “Executing the Long Game: TLT’s Endurance in a Recessional Season”
  8. “Tackling Recession Risk: Going Long with TLT’s Defensive Line”
  9. “The Bond Field Advantage: Going Long with TLT Amid Market Turbulence”
  10. “Scouting for Opportunities: Going Long with TLT’s Recessional Defense”

Now…on to business and what we’re talking about today, which is not related to football but rather recession worries, market strategy, and in our opinion how one should consider adjusting the bond piece of their allocation to hedge what we see coming. If you’re in the growing and increasingly popular camp of preparing for a stock market crash or just a general recession, here’s one adjustment and hedge that you may want to consider.

Continue reading

Permanent Portfolio Review

Dear Mr. Market:

Simple allocation ?

In a year where the stock market has provided zero safe places to hide…you may have changed, the markets certainly have, but one thing has not; the Permanent Portfolio.

We’ve reviewed the Permanent Portfolio before but believe it’s time to check in and provide an update on how it’s doing relative to the broad markets now as well as chime in on whether the strategy still has merit going forward. For some quick background, our first original review was written in June of 2013 (click here to see that). Most recently we revisited the topic with an update in November of 2020 (click here) as we climbed out of one of the wildest years in world history amidst a global pandemic.

If you didn’t hit the embedded article links above, the Permanent Portfolio is pretty simple at face value. The Permanent Portfolio is a seemingly basic portfolio allocation strategy created by investment advisor Harry Browne in the 1980’s and outlined in his book Fail-Safe Investing back in 2001. Here’s the secret (simple) sauce and how each asset class should do during repeatable economic cycles:

Continue reading

Stock Market Correction: Finally!

Dear Mr. Market:

Finally. It’s here….a bonafide stock market correction. What’s also almost here is Groundhog Day…but more on that in a minute. For those of us with short memories we’ll have to do the necessary preamble and small talk refresher on what this is. For those of you who remember what you did (or were supposed to do/not do) during the last correction, here we go again. Do you remember the fantastic Bill Murray movie “Ground Hog Day”? Click here for the last time we wrote about it but again….people seem to forget what they ate for breakfast so you may not remember what happened in 2018.

Oh… but “it’s different this time“, right? Those are indeed the four most dangerous words in investing. Are there problems to worry about? YES!!!! (but there always has been and always will be)

Continue reading

May Gray turns into June Gloom


Dear Mr. Market:Unknown-3

We have discussed many times how emotionally driven you are. On some days you tempt us with your record setting high wire acts and on others we have our lips virtually wrapped around the barrel of a gun in desperation; the stock market is a wicked playground.

We don’t believe that computers or sophisticated investment algorithms can completely mitigate the perils of the stock market or protect everyone from getting out of their own way, but it can at least be used as a starting point. My Portfolio Guide relies on some very unique tools that assess the stock market each month with a fresh set of eyes. While our method of “reading the tea leaves” is not necessarily a crystal ball, it’s definitely not what most investment advisors use….which is the rear view mirror. Sadly enough, many investment advisors are just like you…they’re human and they chase recent returns and mistakenly look back in history as to what has done well. While this method of analysis is the easiest to sell clients (and themselves) it’s not as effective as taking a completely fresh look at what is happening right now and how that is statistically likely to play out in the near-term. Continue reading

‘Twas the Day of the Election…Stock market rally or sell-off?


img_59101Dear Mr. Market:

It’s that time of year again….here comes the holidays. One of the most famous Christmas poems ever begins like this:

‘Twas the night before Christmas, when all thro’ the house

Not a creature was stirring, not even a mouse;

The stockings were hung by the chimney with care,

In hopes that St. Nicholas soon would be there;

What if we changed a few words to reflect what Mr. Market will be thinking about instead of sugarplums and Christmas stockings? What is he thinking on Election Day?

‘Twas the day of the Election, when all through the nation

Every citizen was encouraged to get to a voting station;

Constant stories of Wikileaks and groping

Had every American and the stock market moping;

The media was franticly filling their time with endless chatter

All in hopes that our eyeballs would think a new President would matter;

Whether you’re liberal or conservative we all want a sound future for our girls and boys

As it relates to the stock market it simply prays for an end to this noise;

So goodnight to all and may you wake tomorrow

Knowing full well that some will be joyful and others in total sorrow.

We’ve obviously abbreviated our stock market poem to center on the real question so many investors have: Will this election result drive the markets higher or lower? Continue reading

3 old stories rattling the stock market in 2016

Image

Dear Mr. Market:

You’ve certainly kicked 2016 off with a bang! Even investors that rarely, if ever, look at their portfolio are aware of the rough start to the New Year. Over $8 trillion in market valuations has seemingly disappeared in the blink of an eye. Many are pounding the table with a bear market narrative capturing your attention and emotions but is there anything truly different this time?

There are many different factors at play in this volatile market environment but in our opinion none of them are really all that new nor are they indicative of a bear market, a recession, or impending crash. We’ll briefly touch on each of them but at the end of this article you may be surprised to learn why we believe this market could bounce strongly when least expected.

Currently there are three factors that are dramatically impacting the markets: China, Oil and the Fed. It appears that when these are combined it creates a combustible combination that not even the most seasoned analysts know how to handle! The reality is that the stock market and all the ‘experts’, who analyze and report on it, seem to have short-term memories. For lack of a better description people have also been put to sleep and forget what it’s like to see a normal market correction. Let’s quickly break them down and attempt to put them in perspective: Continue reading

Q3 2015 Stock Market: Déjà vu of 2011 not 2008!

stock-market-correctionDear Mr. Market:

Have you ever watched an old rerun of your favorite TV show or perhaps enjoyed the same movie twice? Of course you have…

Can the same be said for watching similar patterns in the stock market? While nobody wants to see the market go through a nasty quarter like we just witnessed, like it or not, it will happen again. Stock market corrections are not predictable and they air on their own time!

Our opinion, however, is that the stock market in 2015 is very much like the one we saw in 2011. History may not always unfold just as it has before, but several patterns and background indicators tell us that there is a lot to learn from the 2011 stock market year. Take a quick peak at the end of this article for a visual representation of how the markets did from May to late October in 2011 and 2015.

Most of us can’t remember what we had for dinner last night so as a quick refresher let’s summarize what was going on in 2011:

During the summer of 2011 all of the news headlines and the overall narrative was absolutely negative. The sovereign debt crisis in Greece rattled nerves daily. Comparisons of Greece vanishing were eerily similar to the disaster of Lehman Brothers going bankrupt just three years prior. Almost all the financial pundits also talked about the Fed raising interest rates and what a devastating impact that would have on the market. Sound familiar??? Continue reading

MPG Core Tactical 60/40: August 2015 Performance Update

MW-BB798_sm6040_20130422180557_MDDear Mr. Market:

If you’ve never experienced a stock market correction until now (technically defined as -10% or more), you have either never invested or have only been investing since 2012. For the vast majority of others, you should know that markets “correct” on average at least once every 12-18 months. One reason why this feels worse than other corrections is because we just went 47 months without a correction of -10% or more! (third longest streak on record)

For a refresher, stock market corrections are short and sharp declines of -10% to -20%. They’re typically accompanied by sensationalized stories such as the European sovereign debt crisis, Greece’s exit from the Euro, or the “fiscal cliff”. For all those investors that ducked for cover and went to cash during the last correction you saw the Dow Jones move up over 6,000 points. Were you able to correctly “time” your reentry into the market? No…and you’re not alone. No matter what you read or hear there is not a single person or professional advisor that owns a crystal ball and can consistently time the market.

If you’re new to this monthly series…remember what we’re doing. This exercise, as we like to call it, is not an attempt to pick the best stock or “time the market”. We leave that futile task to those who own time machines and accurate crystal balls. For a refresher, see our first article on the MPG Core Tactical 60/40 Portfolio.

Here’s the current summary of the MPG Core Tactical 60/40 portfolio mix, which is updated as of this writing (September 1, 2015).

Click here to compare our portfolio against the benchmark.

From the last week in July to this writing the MPG Core Tactical 60/40 portfolio went down -4.49%. How did the rest of the markets do? Continue reading

MPG Core Tactical 60/40: March 2015 Performance Update

 MW-BB798_sm6040_20130422180557_MDDear Mr. Market:

You don’t have to be a professional money manager to be aware that the swift decline in oil prices has been one of the most impactful financial headlines in years. As a matter of fact if you didn’t own a computer, read a newspaper, or have basic access to media, you would still know that oil has dropped like a rock. All you had to do was go to the gas station and see that it costs far less to fill up your tank today than it did last year.

What you may not have noticed, however, is the huge appreciation in the U.S. dollar. The U.S. dollar index compares the dollar with a basket of other currencies and it spiked up 50% in the first couple weeks of March. It has already risen almost 8% year to date and this has impacted the stock market in ways that many are unprepared for. With any situation like this there are silver linings and opportunities that we’ll discuss later in this article.

First let’s review where we’re currently at and what we did last month:

Here’s the current summary of the MPG Core Tactical 60/40 portfolio mix, which is updated as of this writing (April 1, 2015).

Click here to compare our portfolio against the benchmark

What adjustments did we make?

The following moves were made during the month of March:

3/13/15:  Bought 200 more shares of VO (Vanguard Mid Cap Index) @ $126.19 ~$2 worth

3/25/15:  Bought 75,000 final shares of MONIF (Monitise) @ $0.191 ~$14k worth Continue reading

March Madness: Final Four Investing Bracket 2015

basketball on cashWelcome to the fifth year of our March Madness Investing Bracket! This series of articles is always one of the most popular investing articles on the internet! We’re proud to admit that we were one of the first investing nerds to combine our love for the markets with the passion that college basketball brings!

It’s common knowledge that people love excitement and surprises. It’s also human nature to root for the underdog and many times those two themes can certainly play out on the basketball court as well as on the stock market floor. Much like two college basketball teams that never play each other our imaginations are swept up in wondering who will “win” between a relatively unknown investment or a popular stock that has the media in a frenzy.

You may be asking what does a basketball tournament have to do with managing your portfolio or the investment world in general? At first glance there might not be much but we thought we would have a little fun and couple it with some asset allocation parallels. After all, there are many folks who have simply thrown their hands in the air at one time or simply succumbed to the notion that investing is like educated gambling. There could be some truth to that depending on your approach…

For those of you that are not familiar with the NCAA and its annual basketball tournament there are 68 teams selected and each is seeded according to their results throughout the regular season and their relative rankings. Every March the NCAA holds a single elimination tournament to crown an undisputed champion. Part of the appeal of such a tournament is that theoretically any team that makes the “big dance” has a shot at winning it all. Each and every year there is a proverbial “Cinderella” team that surprises everyone including all the ‘so-called’ experts. Prior to the tournament there is always plenty of banter and opinion on who wasn’t invited or further arguments around the seeding of the teams that did make it. That’s where we see a parallel of sorts to investing and having to make decisions among the multitudes of investment choices. With so many investment choices available, there are also as many differing opinions.

In the “real” March Madness tournament this year there appears to be a hands down favorite with the undefeated Kentucky Wildcats. Hardly any office pool or basketball analyst is betting against such a heavily favored team. If they win it all it will be the first time in over 30 years that a team stays unbeaten the whole season. Our own version of this (using investment themes and choices) shares the premise that we have four very decent #1 seeds but there is no slam-dunk pick that everyone agrees on. For this reason, our 2015 bracket is perhaps as important as ever to understand that a dark horse could win it all…

Before we begin digging into each “region” of our bracket, let’s revisit something everyone claims they know but so very few actually follow with consistent discipline. (Asset Allocation)

If you have ever looked at a chart of all the different asset classes and how they perform year to year…there is rarely a pattern or consistent way to determine next years “winner”.

For the purposes our annual investing bracket we have “seeded” or ranked four major asset classes (like the regions) and chosen several individual picks within each. There is some basic science applied to this process. We consider how the “pick” did over the past 12 months and also how it has trended over the past three months. In some cases we gave a lower performing investment a higher seed if it was trending well with recent strength or was more consistent over a longer period of time.

Each asset class (Large Cap, Small Cap & Mid Cap, Bonds/Alternatives, and International) was ranked and seeded, then corresponding seeds were assigned to “picks” that we are either adding to the portfolio or establishing new positions in. Note that we’re not highlighting 68 new investments and will only discuss some investments that we are either actively involved in or looking to add to most portfolios.

OK…Let’s dig into some of the key match-ups and explain why our Final Four going into Q2 2015 looks the way it does (CLICK HERE to view our 2015 Bracket):

Large Cap

This is typically viewed as the ‘efficient’ asset class. Continue reading