3 Common Diversification Mistakes

Dear Mr. Market:Diversification 2

Whether you handle your portfolio or hire a professional to manage it, there is no way you have not heard of the importance of diversifying your investments. The reality is, however, most investors fall prey to one of three major diversification mistakes; which of the three is your issue?

First and foremost, let’s briefly review what diversification is:

Investopedia defines Diversification as: ‘A risk management technique that mixes a wide variety of investments within a portfolio. The rationale behind this technique contends that a portfolio of different kinds of investments will, on average, yield higher returns and pose a lower risk than any individual investment found within the portfolio.

At first glance this makes sense and doesn’t appear to be complex, right? We find that investors typically appear to be in one of three different camps when it comes to diversification:

  1. Under Diversification
  2. Improper Diversification
  3. Over Diversification

Let’s take a moment to look at each and how investors can get their portfolios back on track. Continue reading

MPG Core Tactical 60/40: April 2014 Performance Update

MW-BB798_sm6040_20130422180557_MDDear Mr. Market:

Unless you’ve never picked up a financial magazine or read the business section of any newspaper, you have undoubtedly heard of the old investment adage “Sell in May and go away”. Many financial “experts” and journalists do their best to paint the summer months as those that are primed to underperform. Does history always repeat itself in exactly the same way? Nope. It’s not hard to find investors who sold last spring (or even the one prior) in anticipation of a nasty summer and they are still in cash or underweight equities. If you’re in that boat and don’t trust the stock market, you may sleep better at night for now but in the interim you’ve lost opportunity cost and missed another bull market.

The flip side to this is that bearish investors will eventually be right! The S&P 500 has not had a correction of -10% or more since October 3, 2011. Like many investors out there we firmly believe a correction of -10% to -20% is coming this year but we don’t think it will be the start of a bear market. The challenge behind all of this, however, is that the longer we go without a healthy correction the deeper and more severe the inevitable sell-off will be. Continue reading

What’s the Asset Allocation of your Investing Freeway?


images-44

Dear Mr. Market:

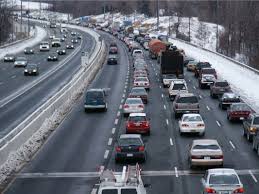
Nobody likes traffic but it’s without question a part of our daily lives. Being stuck behind a long line of cars and seeing nothing but red taillights is even more aggravating when you are short on time and need to be somewhere soon. Many of us try to do whatever we can to avoid traffic; whether it be leaving earlier, taking side streets, carpooling, or relying on tools like GPS apps that show us the best routes to take. What does this have to do with investing? Everything…

If you haven’t yet learned or heard why the freeway is perhaps the most important analogy for the success of your portfolio…you need to commit this article to memory. Your local freeway can teach you why 90% of your portfolio’s performance is dependent on what lanes you choose to drive in and only 10% on how fast your car is.

Take for example, Interstate 405 in Los Angeles…which happens to be the busiest stretch of highway there is in the nation. Let’s say you need to get from Long Beach to LA in what normally takes about 30 minutes. You hop in your car and hit the fast lane and seem to be making great time averaging 65 mph. No sooner than about 10 minutes into your drive your lane comes to a screeching halt. After about almost a mile of grinding away at five mph you decide to switch into the lane to your right which is now flowing much faster. Almost within seconds of doing this, the lane you were just in passes you by! Your 30 minute trip to LA will now take you at least an hour and possibly more at this pace.

This simple but nightmarish traffic scenario happens daily to over 400,000 drivers along the 405 but it also absolutely ruins millions of portfolio every year! Pretend each lane of the freeway represents an asset class. (ex: Large Caps, Small Caps, International, and Bonds) On any given year one “lane” (or asset class) will lead the markets but the likelihood of it doing so the next is rare and if you look at historical returns there is no discernible pattern. CLICK HERE to review how asset classes have performed each year from 1994 to 2013:

One of the better examples of this is Emerging Markets in the early 2000’s.

The BRIC’s (Brazil, Russia, India, and China) were all the rage from 2003 until 2007. Hardly any investors had the courage to step in until late 2007 because they were still licking their wounds from the “dot com” crash. Many people hid in cash or gravitated to Bonds which turned in a +10.26% year in 2002.

Over the next four years Bonds Continue reading

MPG Core Tactical 60 /40: March 2014 Performance Update

MW-BB798_sm6040_20130422180557_MDDear Mr. Market:

March has turned in another month of stubborn market defiance as the investment world is waiting for a correction yet it never seems to come or fully develop! It’s without question that many of the warning signs continue to lurk below the surface but the S&P 500 has still managed to tack on about another +1%. Year to date we’re just about 1% of where we started 2014 but it sure feels uncomfortable for many.

If this is your first time reading about our MPG Core Tactical Portfolio please refer back to our first post. (click here) In short you will see what adjustments we make throughout the year on a $1 million dollar portfolio and how that performs relative to a portfolio that is rebalanced once per month with an allocation of 60% Stocks and 40% Bonds. Continue reading

How did your Portfolio do in January of 2014?

MW-BB798_sm6040_20130422180557_MD

Dear Mr. Market:

Apparently you’re kicking off February much like you wrapped up January; in correction mode.

A stock market correction is actually not a bad thing and in this case it’s actually a MUCH needed one. If you’re anything close to being a long-term investor you should be hoping for at least a 10% haircut at some point before 2014 wraps up. Without a breather or some form of consolidation this market has no chance to build a base and move to higher levels by year-end.

If you had a fairly well balanced and allocated portfolio in 2013 you probably looked at your statements and saw that bonds were not just dead weight but rather a huge drag on performance. Not only did the overall bond market lose at least -2% for the year, the proverbial “writing on the wall” was being etched in permanent ink ; bonds had zero upside and only risk associated with them. If rates are to rise, as so many speculate they will, we could see bonds sting investors worse than any other time in history. Bottom line: That’s scary stuff for anyone in the typical 60 / 40 model…

The place to be in 2013 was stocks, but let’s be honest… Did you really trust them to keep going higher and higher? Did a +32% return for the S&P 500 feel “real” to you? Most people we talk to still don’t trust stocks but they ironically weren’t invested in them as much as they would’ve liked. Those that couldn’t resist a record breaking stock market finally cut bait on their bonds. Unfortunately, the reality is that our 5 year stock market party is possibly coming to an end…or at least a healthy pause. Continue reading

Force your Portfolio to be Disciplined in 2014

Rebalance Cartoon

Congratulations Mr. Market…you’ve delivered a tremendous year of returns to equity investors!  With the broad equity markets delivering returns over 25% (S&P =29%, DJIA = 25% and the NASDAQ = 37% as of 12/27/2013) investors are now faced with the question of what to do now?  For those investors that were invested in stocks, especially domestic stocks, year-end statements are going to look very impressive but remember that is only on paper. As we step into 2014 what should investors do with their portfolios?

Often investors choose to go with an adage commonly heard in casinos – “Let it ride!” Although the market defied odds and dodged several ominous obstacles, there is no guarantee that it will continue to do so going forward.  Sitting back and doing nothing could very well allow those returns to dwindle away and become nothing but a memory.  It wasn’t that long ago that ‘The Tech Bubble’ hit investors with a strong left uppercut that they never saw coming.  Mr. Market delivered three years of impressive returns (1997 = 33%, 1998 = 28% & 1999 = 21%) only to see it disappear with three consecutive years of negative returns (2000 = -9%, 2001 = -11%, 2002 = -22%) and let’s not forget 2008 (-37%).   How can investors avoid repeating history while also managing the risk and unrealized gains in their portfolio?  Continue reading

How Should your Portfolio be Performing now?

outside boxDear Mr. Market:

How is my portfolio doing this year? Am I on track for retirement? Why is the market up big but I’m not? What would my portfolio look like if the market tanked again like it did in 2008? I’m in cash right now because I feel stocks have moved too high but I don’t trust bonds because we all know where they’re headed.

These are some common and very typical questions many investors are asking themselves this year. If any one of these questions applies to you or feels familiar, don’t think you’re alone! One common thread among all these questions or concerns is benchmarking. What exactly is a benchmark and which one is appropriate for you?

Far too often investors compare themselves to other investors, strategies or benchmarks that are completely unrealistic.  Investors need to take the time to truly understand who they are and what their goals are before they compare themselves to anyone or anything!   Let’s put this in perspective…. Let’s say you decided you wanted to start swimming to get in shape.  Would you expect to get in the pool and swim times comparable to Michael Phelps (winner of 22 Olympic medals) within a couple of weeks?  Of course not… that would be ludicrous and clearly not the right athlete to try and compare yourself to!  As crazy as this sounds many investors have similar expectations with their investment portfolio. Continue reading

How to Add 3 Nobel Prizes to your Portfolio

nerd money Dear Mr. Market:

What if you, the investor, had all the knowledge and findings that it took to win a Nobel Prize in Economics? Would you be a better investor? Believe it or not…with the amount of news disseminated in today’s hyper-information and “data dumping” world…you likely already have all it takes to be a more disciplined and well schooled investor.

This past Monday (10/14/2013) the winners of the prestigious Nobel Prize for Economics were announced.  All three winners were American, which marks a trend as at least one American has won the award since 1999.  The winners: Eugene Fama, Lars Peter Hansen and Robert Shiller were recognized for their outstanding research and work in the financial markets.  While their work does not perfectly align there are several similarities and the bottom line is that you can never trust Mr. Market!

 Summary Of The Winners:

  • Eugene Fama’s research has revealed the efficiency of financial markets. If you’re a financial advisor who makes a living pitching expensive mutual funds or annuity products at clients you won’t likely have a framed portrait of Dr. Fama in your plush office.  Fama basically states that the market absorbs information so quickly that investors simply can’t outperform it consistently.  He is credited for popularizing the use of index funds as an investment option.
  • Lars Peter Hansen works strictly with data (econometrics), creating statistical models in an effort to test competing theories.  His work has allowed researchers to focus on what truly drives the financial markets. Of the three winners Hansen is the least known and popular but he ironically helps connect the other two winners’ work into something investors need to be aware of; you simply need to derive conclusions from what you do AND do not know.
  • Robert Shiller is best known for creating the Case-Shiller Home Price Index Study and now perhaps for the fact that he is married to Janet Yellen, the next Federal Reserve Chairman.  We’re huge fans of behavioral finance so the next time you hear someone talk about a “bubble” you will know who originally broke ground on the concept. His research has shown that investors are irrational and that markets develop bubbles that will eventually burst (he predicted both the Tech and Real Estate Bubbles). Continue reading

2013: The Year of Stock Market Headline Horrors

New-York-Post-Headless-bo-006Dear Mr. Market:

2013 has truly been a year of political headlines and deadlines. We’ve been yanked around with market threatening troubles ranging from the fiscal cliff, to sequestration, to the government shutdown, to the debt ceiling etc.

All the while the market continues to defy odds which further exasperates any rationally thinking mind.

The irony of recent headlines and the overall market environment is that it’s easy to make a convincing case that they’ll either go down this last quarter of 2013 or that they’ll finish strong and continue their banner-like year. Depending on who you follow, you’ll end up being bullish, bearish, or completely confused! This article will be short and sweet but at the end of it all you’ll know exactly where we stand and what we believe most investors should be doing.  Continue reading

Emerging Markets: Much more than a Contrarian Investment

Unknown-17Dear Mr. Market:

It wasn’t all that long ago when most investors would build a portfolio out with the majority of it allocated in domestic stocks. This “home bias” seems odd though since if you’re truly an investor that is using your eyes to gauge opportunity, you would buy international stocks. U.S. stocks currently represent less than 49% of the world market. As a consumer of products and services just look around and think about all of your favorites. (car, electronics, appliances, toys, furniture, clothing, etc.) Where in the world are they made? We’ve all been educated on the merits of investing overseas by now…right? Not necessarily! The average American investor still has about 90% of their holdings devoted to U.S. companies.

How about we peel the onion one more layer? Of the relatively small percentage of investors that typically hold International stocks even less is allocated towards Emerging Markets. Most people perceive international stocks to carry more risk than domestic stocks (currency risk, political/regulatory risk, transaction risk, and increased volatility). All of this would theoretically be amplified when dealing with even smaller countries in lesser developed regions. Ironically enough, risk is actually lowered when adding international exposure.

Studies show that adding about 25% of your equity exposure towards International actually delivers a higher portfolio return with lower risk (standard deviation) than just holding U.S. stocks alone. Investing in International or Emerging Market stocks has higher stand-alone risk but adding it to a well-built portfolio enhances your diversification and potentially lowers your overall risk. Taking diversification one final step further can be done with “Frontier Markets” which are even smaller, have greater political and economic instability and higher risk-reward ratios. You’ll find that frontier markets have much more volatility than developed or emerging markets but also tend to have better long-term returns.

Adding International ExposureEmerging Markets are getting hammered this year and if there is one guarantee Continue reading