It’s that time of year again. The nets are being cut down, the office bracket pools are being filled out, and somewhere right now a 12-seed is about to ruin someone’s perfect bracket. Welcome to March Madness…the one time of year when a school nobody has heard of can knock off a powerhouse, and when the chalk favorites don’t always survive the first weekend.
We’ve been publishing our annual March Madness Investing Bracket longer than anyone else on Wall Street, and each year it gives us the opportunity to do something most investment firms won’t: put our themes, our convictions, and our best ideas out in public, bracket them against each other, and let the logic play out. Not every pick wins. Not every #1 seed survives. That’s kind of the point.
This year’s tournament feels particularly loaded. Duke and the Boozer twins are the consensus favorite to cut down the nets…a Blue Blood program with generational talent that almost no one is betting against. Michigan, Arizona, and UConn round out the projected #1 seeds. But if March has taught us anything, it’s that favorites get humbled, Cinderella stories emerge from nowhere, and the team that survives isn’t always the one that looked the best in February.
The tariff headlines are back, and as usual, they make for great cable news debates and political talking points. But beneath the surface, there are far more serious considerations. Recent commentary has raised three key concerns about the escalating tensions between the U.S. and China—and none of them are as simple as price hikes at Walmart.
This is perhaps one of our favorite articles and times of the year; not necessarily because of basketball but rather it allows us the opportunity to articulate our main investment themes we see playing out for the remainder of the year. My Portfolio Guide, LLC was the first investment firm to publish a March Madness investing bracket where we share our picks and match them up against each other. We break down and assign each of the four “regions” with an asset class and then pick teams (stocks) that we think have the best chance at doing well relative to others.
Not only is this “exercise” a way for us to share our ideas from a macro perspective, but it offers a fun platform to dig into a couple specific investments and themes we are following or excited about. While NCAA teams battle for supremacy on the court, our annual March Madness Investing Bracket pits stocks and ETFs against each other to determine the investment themes we think are likely to outperform the remainder of the year. The competition spans four “regions”: Large Cap, Small & Mid Cap, International, and Bonds & Alternatives.
Who will be this year’s champion? Let’s break it down (click here to see the full bracket).
If your alma mater or favorite college team did not make the tournament on Selection Sunday, we’ve got another option for you!
Even if you don’t like or follow college basketball, we think you’ll enjoy what we pioneered and have put together.
My Portfolio Guide, LLC was the first investment firm to publish a March Madness investing bracket where we share our picks and match them up against each other. We break down and assign each of the four “regions” with an asset class and then pick teams (stocks) that we think have the best chance at doing well relative to others.
Not only is this “exercise” a way for us to share our ideas from a macro perspective, but it offers a fun platform to dig into a couple specific investments and themes we are following or excited about in the year ahead.
Click here or below to see or enlarge the entire bracket for 2024.
Our Final Four Investing Bracket slots 48 positions against each other and we mainly want to show why we see one investment doing better than another over the course of the next year. One caveat to keep in mind is that while there are 48 total investments within our bracket, it does not mean we like them all; some are there for illustrative purposes or to discuss a certain theme playing out in the stock market. Lastly, the way these are initially “seeded” does not reflect our current confidence in them. For example, a #1 seeded investment could lose right out of the gate just as a #12 could potentially win it all. In other words, these investments (or “teams”) are ranked and seeded on a number of factors but one of the main drivers is how hot they recently performed within the past few months or recent year.
First off, if you want to know how amazing Artificial Intelligence is, the following list of article titles were generated for this article in the matter of four seconds! (we picked the first one and the rest of this article is typed with regular human toiling!)
FYI: If you’ve never used ChatGPT, before try it! Much of its delivery is on what and how you ask things and in this case here is the prompt/reply that we asked of it:
Certainly! Here are a couple of article title ideas that play on the “going long” football reference while discussing extending bond allocations, especially in a recessionary context and using the TLT ticker symbol:
“Going Long in Two Fields: Why TLT Could Be Your MVP During Recessions”
“Huddling Up for Stability: TLT’s Game Plan for Going Long in a Recession”
“Scoring Big in Bonds: Going Long with TLT Amidst Recession Signals”
“Touchdown for Investors: TLT’s Playbook for Going Long in Uncertain Markets”
“Bonds and Touchdowns: TLT’s Strategy for Going Long in Recessions”
“From Gridiron to Portfolio: Going Long with TLT’s Defensive Play”
“Executing the Long Game: TLT’s Endurance in a Recessional Season”
“Tackling Recession Risk: Going Long with TLT’s Defensive Line”
“The Bond Field Advantage: Going Long with TLT Amid Market Turbulence”
“Scouting for Opportunities: Going Long with TLT’s Recessional Defense”
Now…on to business and what we’re talking about today, which is not related to football but rather recession worries, market strategy, and in our opinion how one should consider adjusting the bond piece of their allocation to hedge what we see coming. If you’re in the growing and increasingly popular camp of preparing for a stock market crash or just a general recession, here’s one adjustment and hedge that you may want to consider.
And so are we… The world stopped pretty much everything at one point during the pandemic and sports were of course no exception. For true sports fans there was nothing more depressing than watching cornhole tournaments or empty arenas void of fans, sounds, and energy. Even if you don’t like or follow college basketball, we think you’ll enjoy what we pioneered and have put together.
We’re proud to say that My Portfolio Guide, LLC was the first investment firm to publish a March Madness investing bracket where we share our picks and match them up against each other. We break down and assign each of the four “regions” with an asset class and then pick teams (stocks) that we think have the best chance at doing well relative to others.
Not only is this “exercise” a way for us to share our ideas from a macro perspective, but it offers a fun platform to dig into a couple specific investments and themes we are following or excited about in the year ahead.
Click here or below to enlarge and see the entire bracket for 2023.
You’ve behaved fairly well after some insanely raucous behavior last year. You (the market) has actually surprised a lot of folks just barely six weeks into the year. While there is plenty of calendar left in 2023, we’re watching you and it’s simply interesting to see that half the room doesn’t trust your next move while the other half wants to… but still can’t!
The books are closed on 2022, and what a year it was! The past few years have brought the word “unprecedented” to a whole new level. Both stocks and bonds were down in 2022, which is extremely rare and actually only happened twice in the past 100 years! (1931 and 1969). We won’t rehash it all but it’s not just that stocks were down almost -20%, but rather that what was supposed to offset some of that drawdown, never did. Historically bonds have basically always mitigated some of the pain of stocks getting tattered but not last year. 10-year treasury bonds were also down -15% and if you want real pain, 30 year bonds got torched by almost -30%. Name a stretch in your lifetime that was worse? Even if you’re 90 years old…you can’t.
So, enough about what has happened but our focus today is on how this plays with your mind. Below we’ve written a list of all the financial media talking heads as well as economic experts who are notpredicting a major recession. Look through our extensive list of names and what do you see?
Oh wait…there are no names listed. Feel free to comment below or let us know if we missed anyone but rarely have we ever seen such an environment of groupthink that it begs the question…what if they’re all wrong? There have been some major economists who in times past have really missed the mark but for some reason they still have a platform and the ability to get your attention. In a future article (or letter to you, Mr. Market) we’ll do a little report card on all the “gurus” who somehow still command everyone’s eyeballs but often can’t correctly guess how many fingers they have. OK…perhaps we’re laying it on a little thick here but hopefully you get the point. There is too much groupthink going on right now and it’s times like these when it pays to take a little bit of a contrarian view.
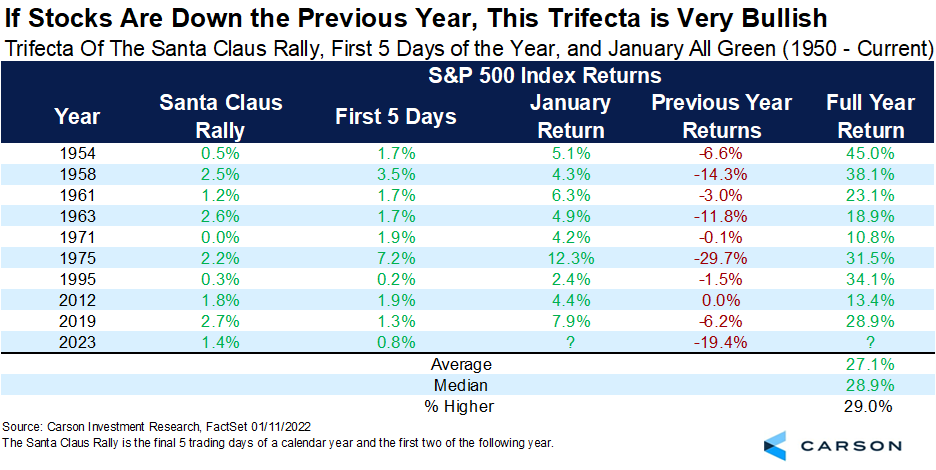
We wrapped up January in surprisingly good fashion (again…almost everyone got it wrong but we’ll modestly remind clients we did not). Couple that with what is the proverbial “Santa Claus” rally period and you have some interesting history to look at. When stocks are lower the year prior, but gained during the Santa Claus period and first five days of January…we’ve seen a market average +27% the next year. Could it happen this time? Maybe not to that extent but if it doesn’t it will be the first time ever it didn’t at least go higher (nine for nine prior).
Now nobody said it would be smooth sailing (it rarely is). Expect a bit of a cooling down period as we now digest Q4 earnings season until month end. It also happens to be seasonally be a time for a natural pause or break with the back half of February being historically weak.
Regardless, barring some major unexpected calamity, this likely pause in the markets is a perfect opportunity to not only catch your breath (with Mr. Market) but also take a few chips off the table in areas you’ve been wishing you had earlier. For example, most people who had way too much tech on the way up got slaughtered in 2022 with the Nasdaq peeling off -33%. Now that we’ve seen a nice bump in tech stocks to start the year, why not sell some and reallocate to another area?
If you read the recent quarterly newsletter from My Portfolio Guide, LLC, you’ll note the areas we still like. Commodities are down to start the year…what a great place to be building a hedge if you missed their run-up prior. Along those same lines, what also helped our model portfolios last year (relative to what most people had outside of stocks and bonds) was gold. The dollar will retreat some more (unhitching the trailer) so we couldn’t be more bullish on gold being a key component in this environment. One more area that has slumped a bit to start the year are oil stocks (another rare bright spot in 2022). In typical human and emotional fashion, people somehow don’t want single digit multiple (i.e. cheap!) stocks with high yielding dividends. What’s not to like?!? Even Joe Biden told us earlier this week during the State of the Union that we’ll need oil for at least another 10 years…
Lastly, if you’re in the mood on making bets….Here’s a tip for all those watching the Super Bowl this Sunday. If you don’t have a dog in the hunt and are simply “hoping for a good game”…change your tune right now; you should want a blowout (perhaps not for entertainment value but for the market). In years when there is a single digit win during the Super Bowl the market only averages +5% and higher less than 60% of the time. However, on years with double digit margins of victory the market averages +11% and a 79% chance of going higher.
As silly as the “Super Bowl Indicator” is by the way, we did write about it last year (click here) and true to form…perhaps that’s why the market got drilled (kidding!). The Eagles are slight favorites but if you’re just an investment geek and want to root for a team…the football Gods all say the Chiefs need to win and ideally by 10 points or more. It likely won’t happen so enjoy the game and those expensive commercials. By the way, they used to cost advertisers a cool $1 million a few years ago for a primetime spot but are now upwards of $7 million! (and we have the gall to complain about $7 eggs?!?)
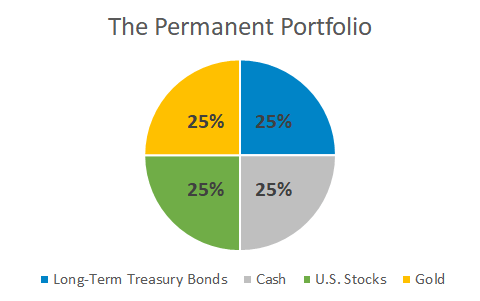
In a year where the stock market has provided zero safe places to hide…you may have changed, the markets certainly have, but one thing has not; the Permanent Portfolio.
We’ve reviewed the Permanent Portfolio before but believe it’s time to check in and provide an update on how it’s doing relative to the broad markets now as well as chime in on whether the strategy still has merit going forward. For some quick background, our first original review was written in June of 2013 (click here to see that). Most recently we revisited the topic with an update in November of 2020 (click here) as we climbed out of one of the wildest years in world history amidst a global pandemic.
If you didn’t hit the embedded article links above, the Permanent Portfolio is pretty simple at face value. The Permanent Portfolio is a seemingly basic portfolio allocation strategy created by investment advisor Harry Browne in the 1980’s and outlined in his book Fail-Safe Investing back in 2001. Here’s the secret (simple) sauce and how each asset class should do during repeatable economic cycles:
That’s exactly where we’re at right now. We’re not going to wait for the financial media to announce it or tell us that it’s only a bear market if we officially drop -20% or more. The intent of this article is to explain not only what a real bear market is, and how this one has behaved differently, but also what to do next.