SpaceX Is Going Public. Here’s Why We’re Not Chasing It on Day One

Dear Mr. Market:

In June of 1997, a little online bookstore called Amazon went public at a market capitalization of approximately $440 million. Today, Amazon is worth nearly $3 trillion. A $10,000 investment at that IPO would have turned into a genuinely life-changing sum of money.

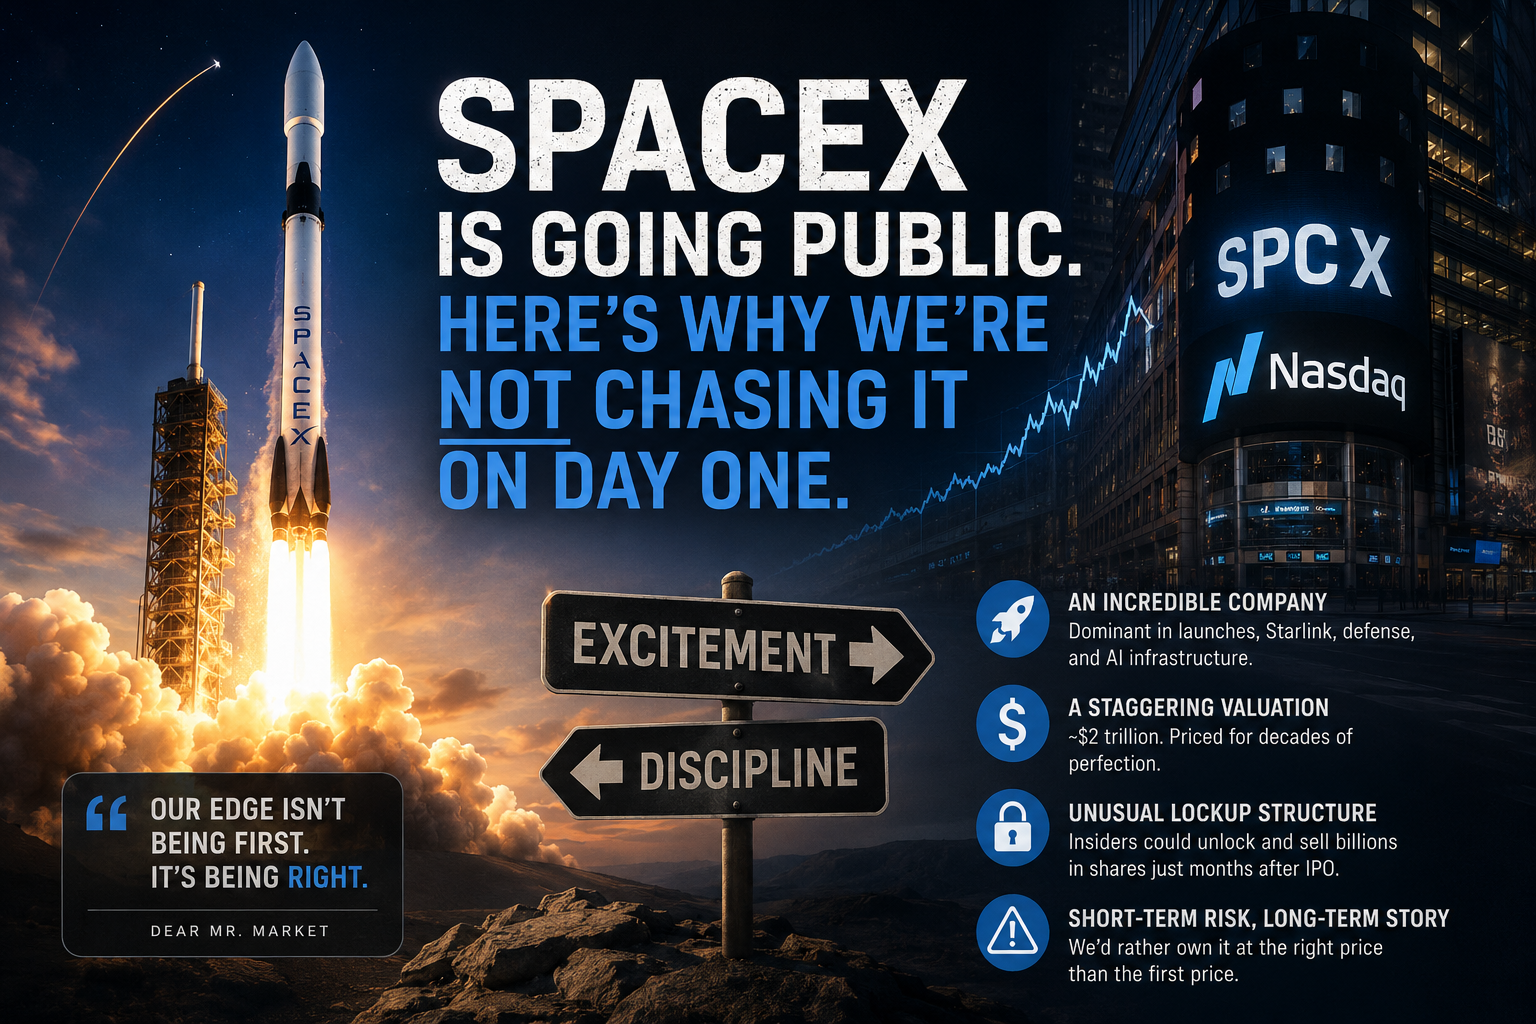
Naturally, investors are now looking at the upcoming SpaceX IPO… ticker SPCX, expected to list on Nasdaq around June 12th , and asking the same question: “Is this the next Amazon?”

Maybe. But there is one major difference that most people glossing over the headlines haven’t fully absorbed.

Continue reading

Top 3 Economic Sectors to Invest in Now

Dear Mr. Market:

It’s clear that nobody has a crystal ball but there are a few simple tools and “rules of the road” which can help manage your unpredictable and volatile behavior. For those of us who are visual learners this simple graphic is quite helpful in knowing where you may want to allocate your stock positions relative to where we are in the economic cycle.

38871_13328881095567_rId4_thumb


There are two curves laid over each other on this graph. Simply explained, the red curve shows you where the stock market is and the green curve shows you what stage we’re at in the current economic/business cycle. Aside from some possible ability to optimally allocate stocks within the most opportune sectors in the economy, the real impact this visual shows you is that the stock market is essentially a leading indicator. In general, the stock market is a forward-looking gauge of what investor expectations are of the economy and interest rates. Continue reading