
Dear Mr. Market:
If the stock market has felt a little more unpredictable lately, there’s a reason to pay attention to the calendar. We’re heading into another midterm election cycle, and history suggests that the second year of a presidential term is often the most volatile stretch of the four-year political cycle.
That doesn’t necessarily mean investors should run for the exits. In fact, the historical data tells a much more interesting story: midterm years have often brought deeper market pullbacks and weaker returns, but the twelve months following midterm elections have historically been among the strongest periods of the presidential cycle.
With the 2026 midterms approaching, it’s worth taking a closer look at what history tells us, what it doesn’t, and why investors should be careful about confusing volatility with danger.
The price of admission
Let’s start with something that shouldn’t surprise anyone who has spent much time investing: stocks go down. Sometimes they go down a lot.
Through the end of October, the S&P 500 has experienced 20 daily declines of more than 1% in 2026. While those days can make for uncomfortable headlines and nervous investors, the long-term average since 1928 is approximately 29 such declines per year. In other words, market turbulence is hardly unusual.
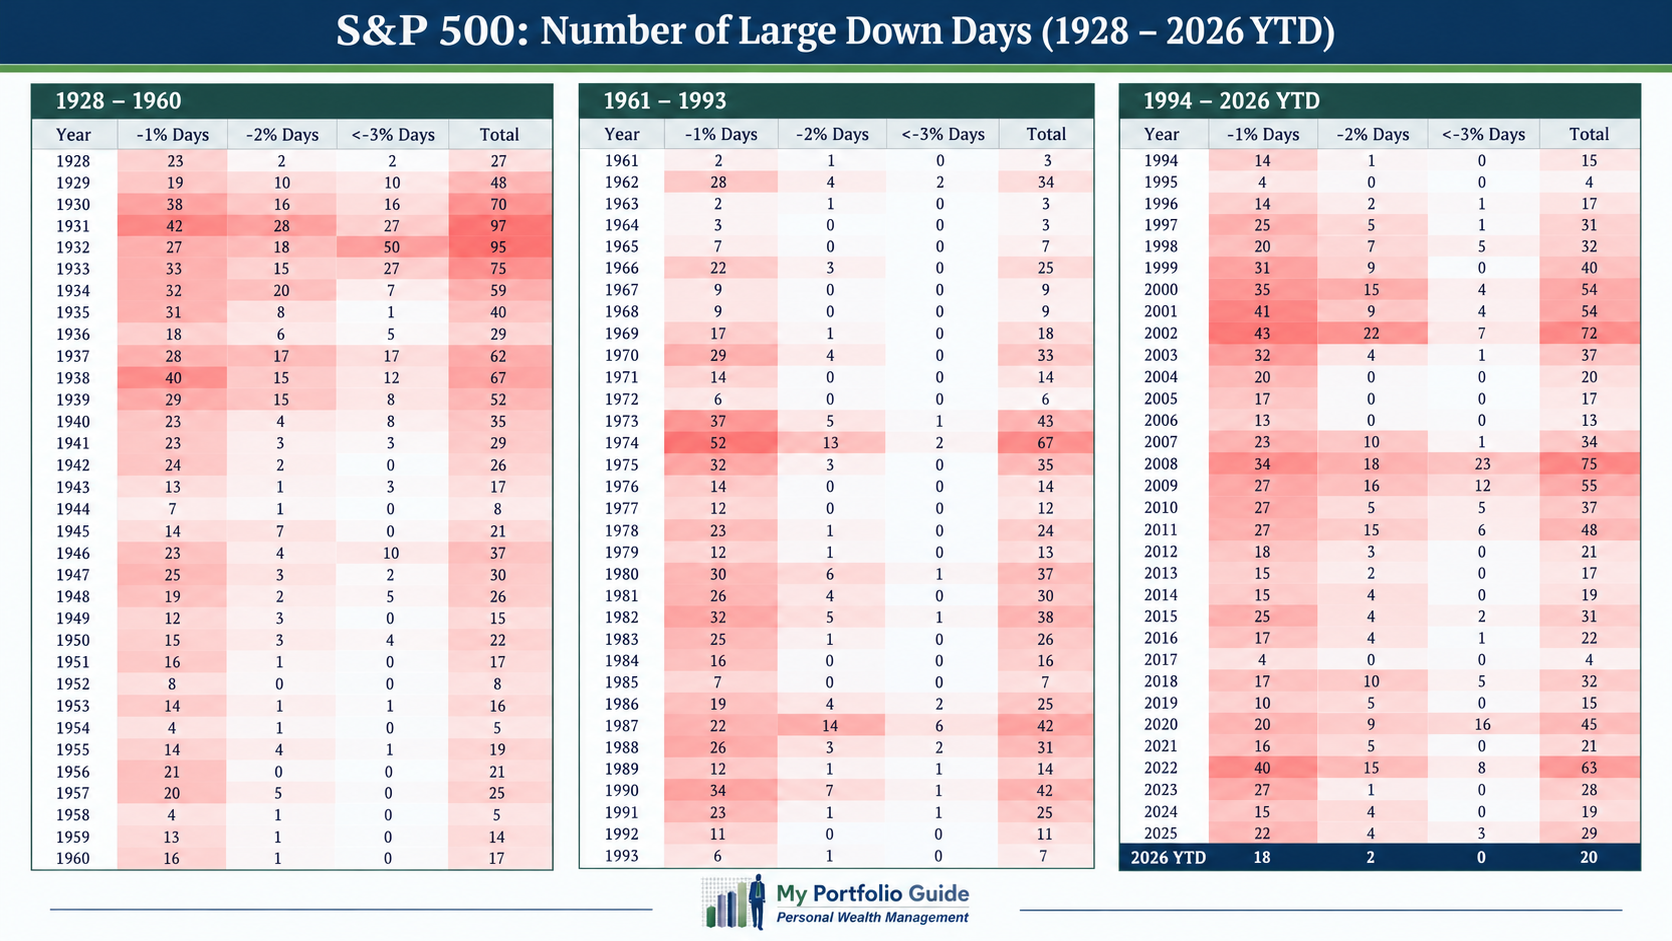
Volatility is the price investors pay for participating in the stock market. The challenge isn’t avoiding every decline. That’s virtually impossible. It’s building a portfolio that can withstand the inevitable bumps along the way without forcing investors to abandon their long-term plans.
Why midterm years tend to be different
Looking back to 1950, midterm election years have historically experienced an average maximum intra-year market decline of approximately -17.5%. That’s compared with roughly -11% to -13% during the other years of the presidential cycle.
Returns have also tended to be more modest. The S&P 500 has averaged approximately 5% during midterm election years, reflecting the uncertainty that often builds as voters, businesses, and investors wait to see how the political landscape will change.
But here’s where the story gets more interesting.
Once the election is behind us and some of that uncertainty begins to clear, the market’s historical performance has been considerably stronger. Since 1950, the S&P 500 has delivered a positive return in the twelve months following every midterm election, with an average gain of approximately +15%.
That’s 19 out of 19 positive periods.
Of course, 19 observations don’t guarantee what happens next. History is a useful guide, not a crystal ball. But the pattern is difficult to ignore.
A seasonal pattern worth watching
There’s another historical trend that deserves attention. Looking at the November through June period following midterm elections, the S&P 500 has posted a positive return in all 21 observations dating back to 1942.
The average gain during those periods was approximately +16.6%, and even the weakest period produced a positive return of +2.5%.
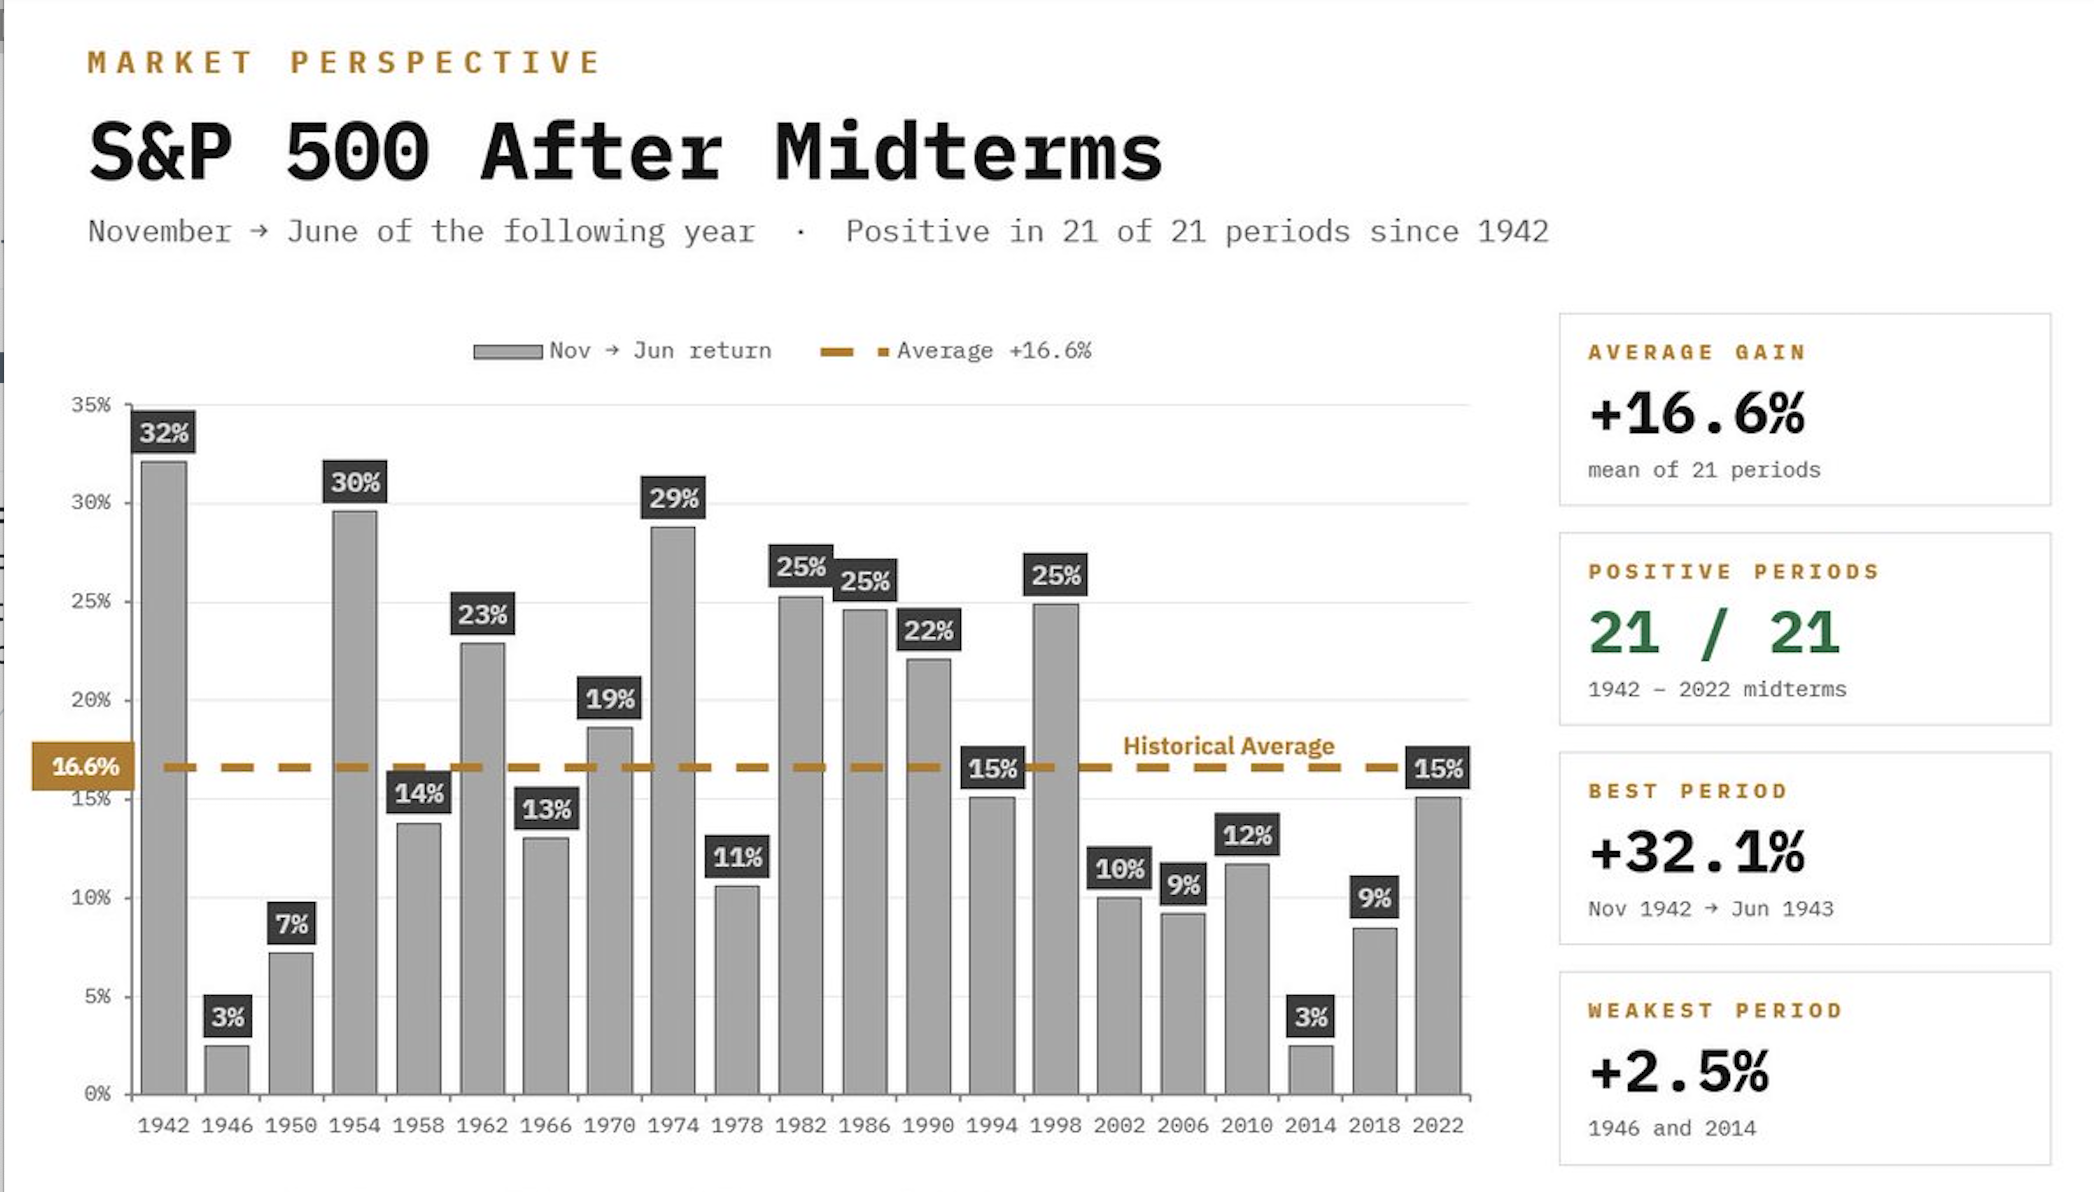
That’s an impressive historical record, but it shouldn’t be mistaken for a prediction. Seasonal patterns can be interesting, and they can provide perspective, but they don’t eliminate risk or tell us exactly when to buy or sell.
The bigger takeaway is that the market has often performed better once the midterm uncertainty passes. Investors who make dramatic portfolio decisions in anticipation of political outcomes risk missing the recovery that has historically followed.
The political wildcard: Does Wall Street actually prefer gridlock?
As we approach the November elections, political control in Washington is once again becoming a major topic of conversation. Polling and election forecasts suggest that control of Congress could be competitive, particularly in the House of Representatives.
For investors, the question isn’t necessarily which party wins. It’s what the outcome could mean for taxes, regulation, government spending, trade policy, and the broader business environment.
There’s a long-standing belief on Wall Street that markets prefer divided government. The argument is fairly straightforward: when neither party has complete control, sweeping policy changes can become more difficult. That can limit uncertainty for businesses and investors.
On the other hand, a change in political control could bring proposals involving higher corporate taxes, increased regulation, or other policies that may affect certain industries and corporate earnings. Those possibilities can create uncertainty, particularly for companies that could be directly affected.
But history doesn’t offer a simple political formula for investing. Markets have performed well under both parties, and research comparing returns under unified and divided government has produced mixed conclusions. The number of historical observations is also relatively small.
Ultimately, the market doesn’t vote. It responds to earnings, economic growth, interest rates, inflation, valuations, and expectations about the future. Political developments matter, but they are only part of a much larger picture.
What matters more than Washington?
It’s easy to get caught up in the political headlines, especially during an election year. But investors should remember that the stock market is ultimately a reflection of businesses, not politicians.
Companies continue to sell products, generate revenue, manage expenses, invest in new technologies, and compete for customers regardless of which party controls Congress. Corporate earnings and cash flows remain important drivers of long-term stock market performance.
That doesn’t mean government policy is irrelevant. Taxes, regulation, trade policy, and fiscal decisions can all influence the business environment. But trying to consistently predict the political outcome, anticipate the market’s reaction, and position a portfolio accordingly is a difficult game to win.
By the time an election result becomes clear, markets have often already begun pricing in the possibilities.
Don’t confuse volatility with opportunity lost
The historical midterm pattern offers an important reminder: uncomfortable markets and poor long-term investment outcomes are not the same thing.
A market correction can test an investor’s patience, but it can also create opportunities for disciplined investors. The key is having a portfolio built around an appropriate allocation, diversification across asset classes, and a strategy for managing risk.
That doesn’t mean ignoring volatility or blindly holding through every market environment. It means making thoughtful adjustments based on portfolio fundamentals and changing market conditions rather than reacting to every headline or political prediction.
At My Portfolio Guide, we believe risk management shouldn’t begin after the market has already fallen. Portfolio construction, diversification, and disciplined rebalancing are important parts of the process well before the next correction arrives.
Midterm years have historically been bumpy. The months that follow, however, have often told a very different story.
We don’t know how the 2026 election will unfold, what policies will emerge, or how markets will react. But we do know that investors who abandon a sound long-term strategy every time uncertainty rises often do themselves more harm than good.
Stay disciplined. Stay diversified. And remember that investing is a marathon, not a political campaign.


Dear Mr. Market is published by My Portfolio Guide, LLC, an independent, fee-only fiduciary investment advisory firm providing personalized financial planning and investment management to individuals and families nationwide. Led by Matthew Pixa, CFP®, MBA, the firm is committed to putting clients’ interests first, offering objective advice without commissions, proprietary products, or hidden conflicts of interest. My Portfolio Guide is an SEC-registered investment adviser serving clients nationwide.
Learn more about our approach to financial planning and investment management at www.myportfolioguide.com.

