Dear Mr. Market:

Aside from extending our warmest wishes to you for a Happy Thanksgiving, we want to remind you that there is something else happening this time of year. We’re entering the strongest part of the year for the stock market as well as one that historically has the best chance to surprise everyone to the upside now that the midterm elections have passed.
Before we start writing things that you may not want to fully believe, let’s start with a quote worth reading:
“On Wall Street, the only thing that’s hard to explain is next week.” – Louis Rukeyser
If we regurgitated a slew of negative predictions right now it would once again sound more intelligent and get most people nodding their heads in agreement. It doesn’t take much of a financial pundit to tap into the “if it bleeds it leads” or “fear sells” crowd. Name a single person you know of right now that does not think we’re either in a recession or that one is coming very shortly.
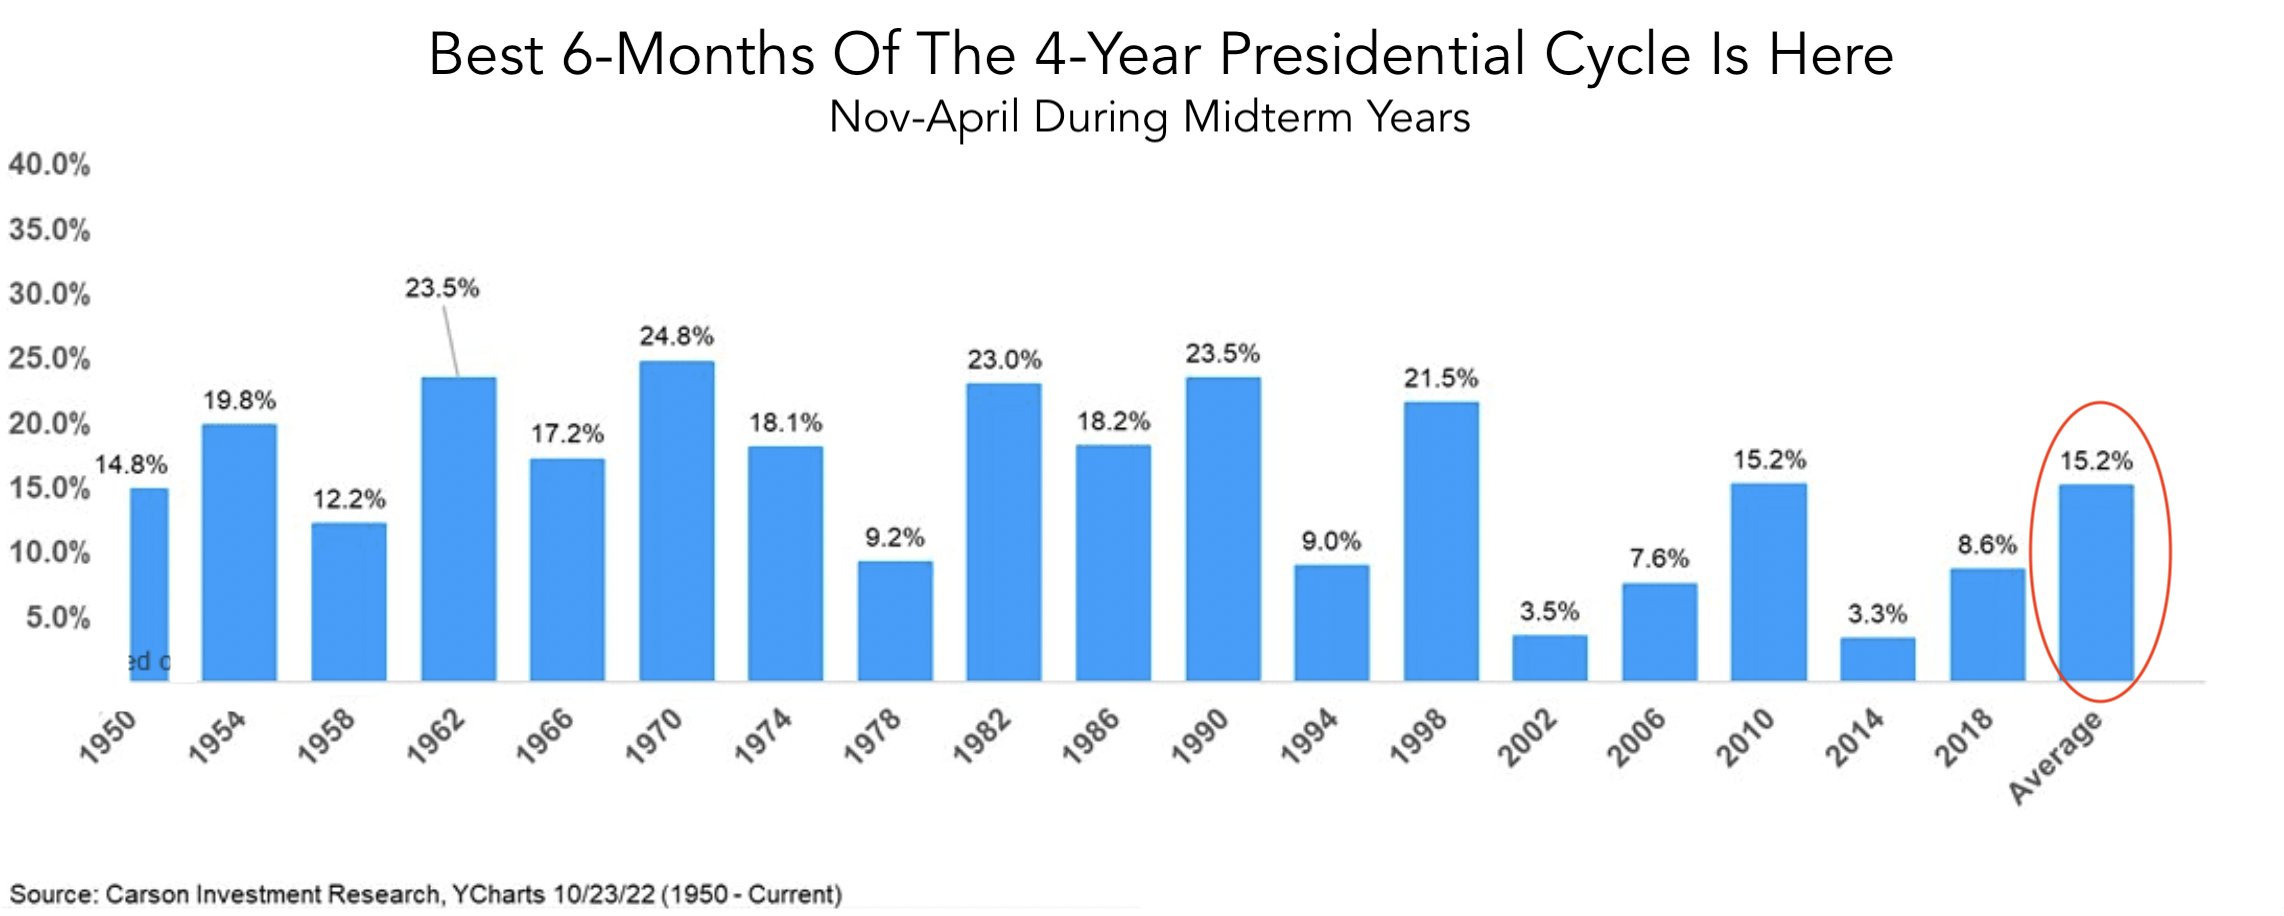
Well….how about instead of playing into the recency bias game we instead share some very real facts that may tell a different narrative? For those visual learners out there we’re sharing several charts today that you need to see with your own eyes. The seasonality we’ve been barking about is not “perma-bull” banter from the rose colored glasses wearing financial advisor we always poke at. The stock market LOVES political gridlock and while the Republicans did not get the “red wave” they may have expected and hoped for, we once again have a split Congress. Here’s what happens after mid-terms:
Like a broken clock there is always the one doomsday prediction that will be right once a day but the odds really don’t look good for anyone who thinks “this time it’s different”.
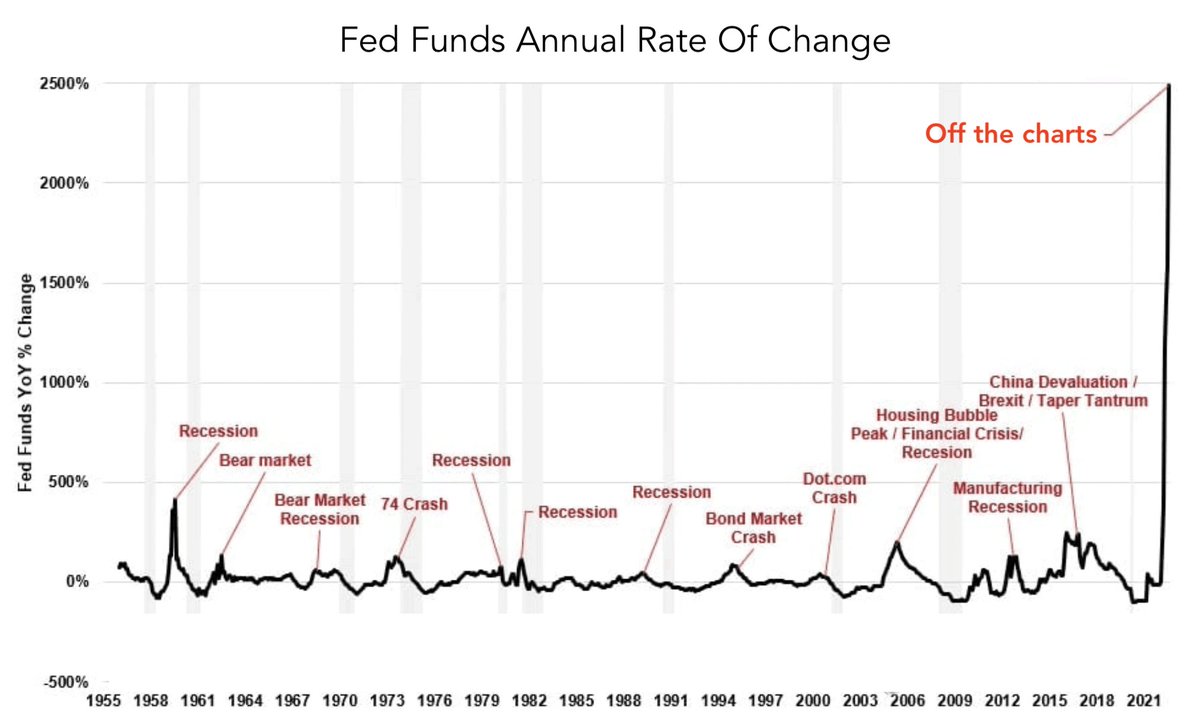
Without rehashing the obvious (but it’s still worth mentioning), the reason the markets have suffered so badly this year is due to the Fed using the one tool they have to absolutely demolish animal spirits; that tool is raising interest rates. We’ve never seen it happen at such an aggressive clip. Like so many charts stemming from an unprecedented pandemic and a forced economic shutdown, we think many of these graphics will look like statistical outliers down the road. So many financial charts will never be the same but for now the financial pundits have to tout the narrative and use the data as they see fit (getting clicks and eyeballs is part of it).
We now have an inverted yield curve which is the proverbial slam dunk indicator that a recession is imminent. We just had another 0.75% hike in November and there’s an 80% probability of another 0.50% increase in December. The way the tea leaves then read, we’ll see a final small hike of 0.25% or two in early 2023. After that, however, is where things get interesting. More on this in a bit…First, another chart showing what happens after an inverted yield curve (where short-term rates yield higher than long-term ones):
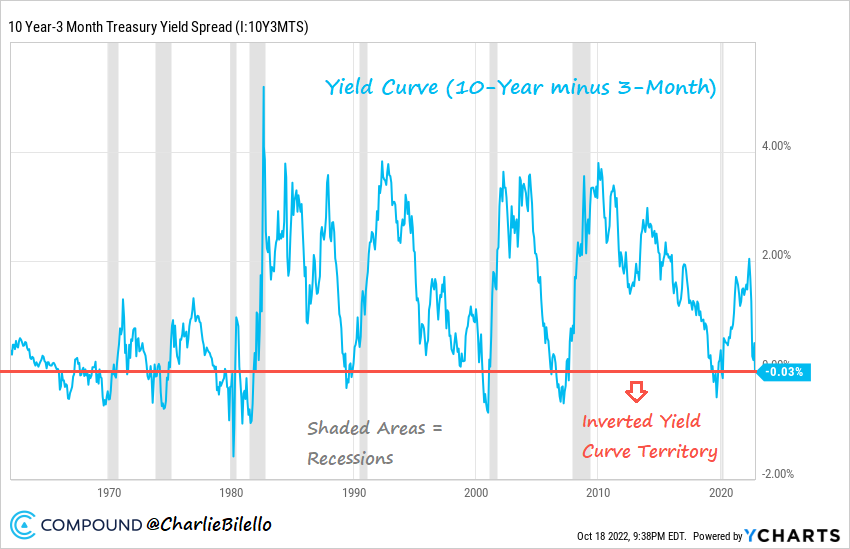
There’s no hiding around the fact that the last eight recessions were all preceded by an inversion of the 10 year Treasury bond and 3 month Treasury yields. October 18th of this year marked the first time since 2020 where you could get a 3 month T-Bill yielding 4.04% or a 10 year Treasury Bond at 4.01%. So…the sky is falling and the worst is yet to come, right?
Not so fast.
What if the Fed overshot this 40 year inflation problem? Also, what if the recession is already underway (in other words the worst part is over) as most economists officially declare recessions well after the fact? Historically, there’s usually been a long lead time between the yield curve inversion and the start of a recession (typically 24 months on average). We don’t think that’s likely to be the case this time around and it may actually end up being the first time an inversion occurs after the start of a recession.
Some naysayers will think we’re being wild contrarians and throwing Hail Mary type financial projections out there. That’s fine; we opened up this article with the Louis Rukeyser quote for a reason. Just don’t rule out a continued recovery in the stock market and a 2023 that could surprise the heck out of people. While most people regurgitate what everyone else says and wants to hear, a 20% plus return in the markets from these levels would not be out of the question if some things happen; like the Fed pivoting and walking back some of it’s hawkish stances.
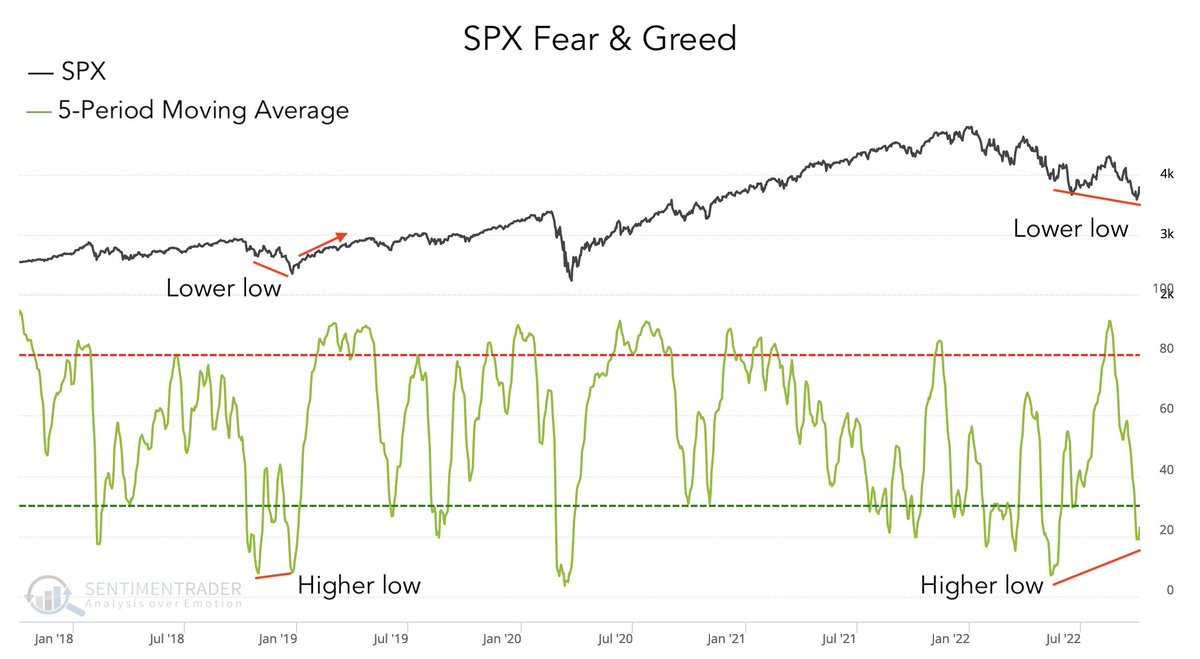
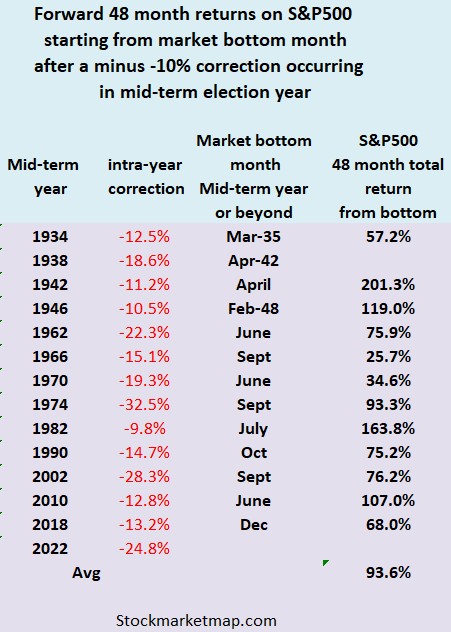
The top chart shows a quick comparison of the markets potentially nearing an inflection point while also pointing to a possible bottom having been put in. Fear and pessimism have rarely seen the levels we recently touched and historically the pendulum now begins to swing the other way. Since 1934, market bottoms have also typically occurred in mid-term election years. From the “bottom” month of mid-term years, or shortly afterwards, markets that produced a greater than -10% correction, have seen 48 month forward total returns come in at mid to upper double digits… so the bounce can (and will) be substantial.
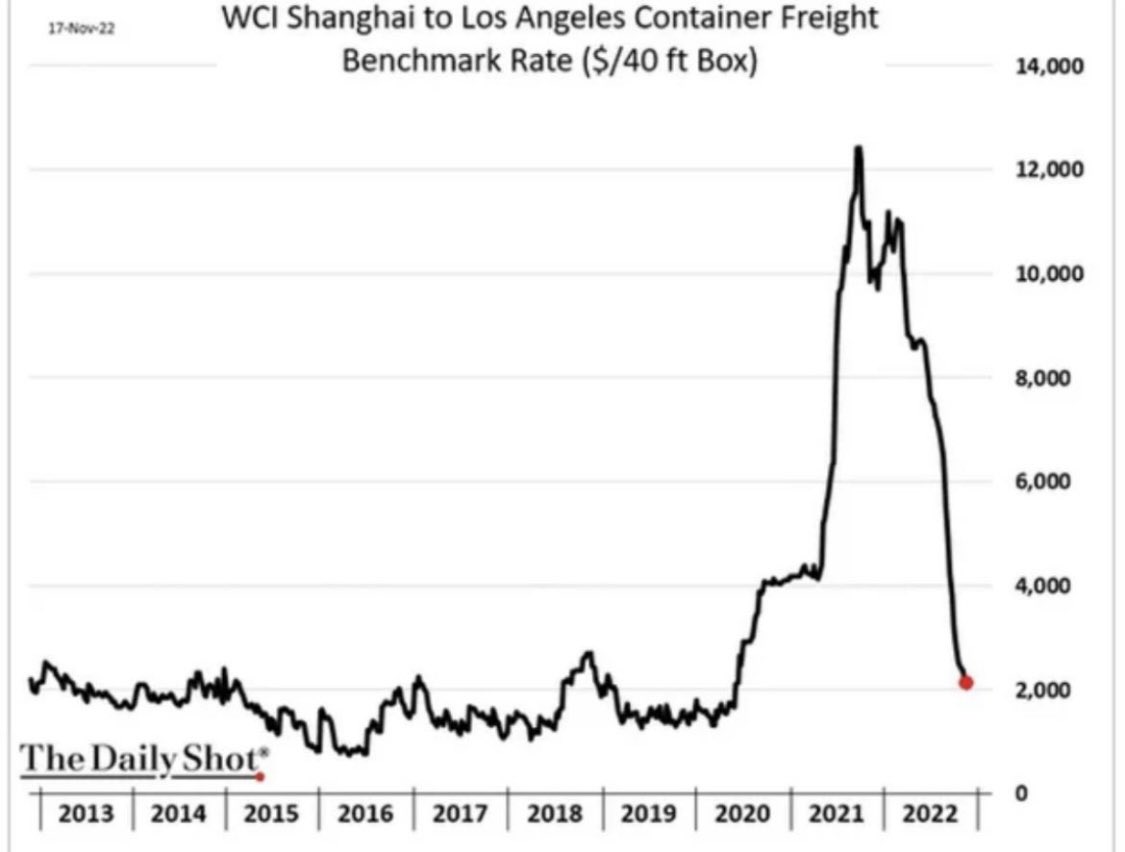
We won’t get into it here but the Fed has been behind the eight ball and reactionary for far too long. Our contrarian thought is that inflation might actually be past its worst point even though we’ll hear more about it for at least a couple of years. Remember that a third of the CPI number is from shelter prices and the housing market has already begun cooling off quite a bit. Mortgage applications for new purchases are down -41%. We’re also seeing a massive drop in lumber prices, used car prices, and now shipping rates (down -83% from a year ago).
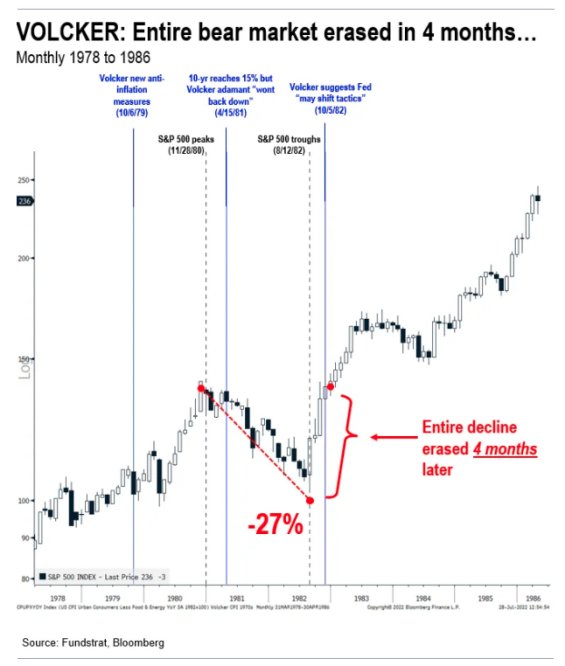
One last chart for today but hopefully you see parts to a different picture that you’re not shown all the time. We’re not out of the woods yet and there will of course be more turbulence. That all being said, watch out for some year-end momentum that we’ve been talking about. It’s not only happening now but could really melt upwards without too much help or a surprising catalyst of good news. People will see that things got overdone and just like every other bear market in history, it will recover and eventually climb a wall of worry to new all-time highs. If the Fed pivots, you could see a market pop and erase much if not all of the brutal drawdowns we’ve all experienced this year. For some context and history, take a peek at what happened in October of 1982…
In the meantime, help yourself to an extra piece of turkey or slice of pumpkin pie. Hug those you love and reach out or help someone in need. We’re all so blessed and sometimes have to be reminded of it.


